remoteMonitoring OOT Development blog (GSoC 2026)
Weekly blog on development
View the Project on GitHub ZiadFahmyZewailCity/blog-gr4.0-remotePlotting
Core Architecture of the module
by Ziad Fahmi
Hello everyone
Sorry for the gap between this post and the last, life got in the way.
Exciting news ! The core architecture of the module is nearly complete, being the part of the code which enables the connection between the GR4 flowgraph and the dashboard in the browser.
What does the core architecture look like ?
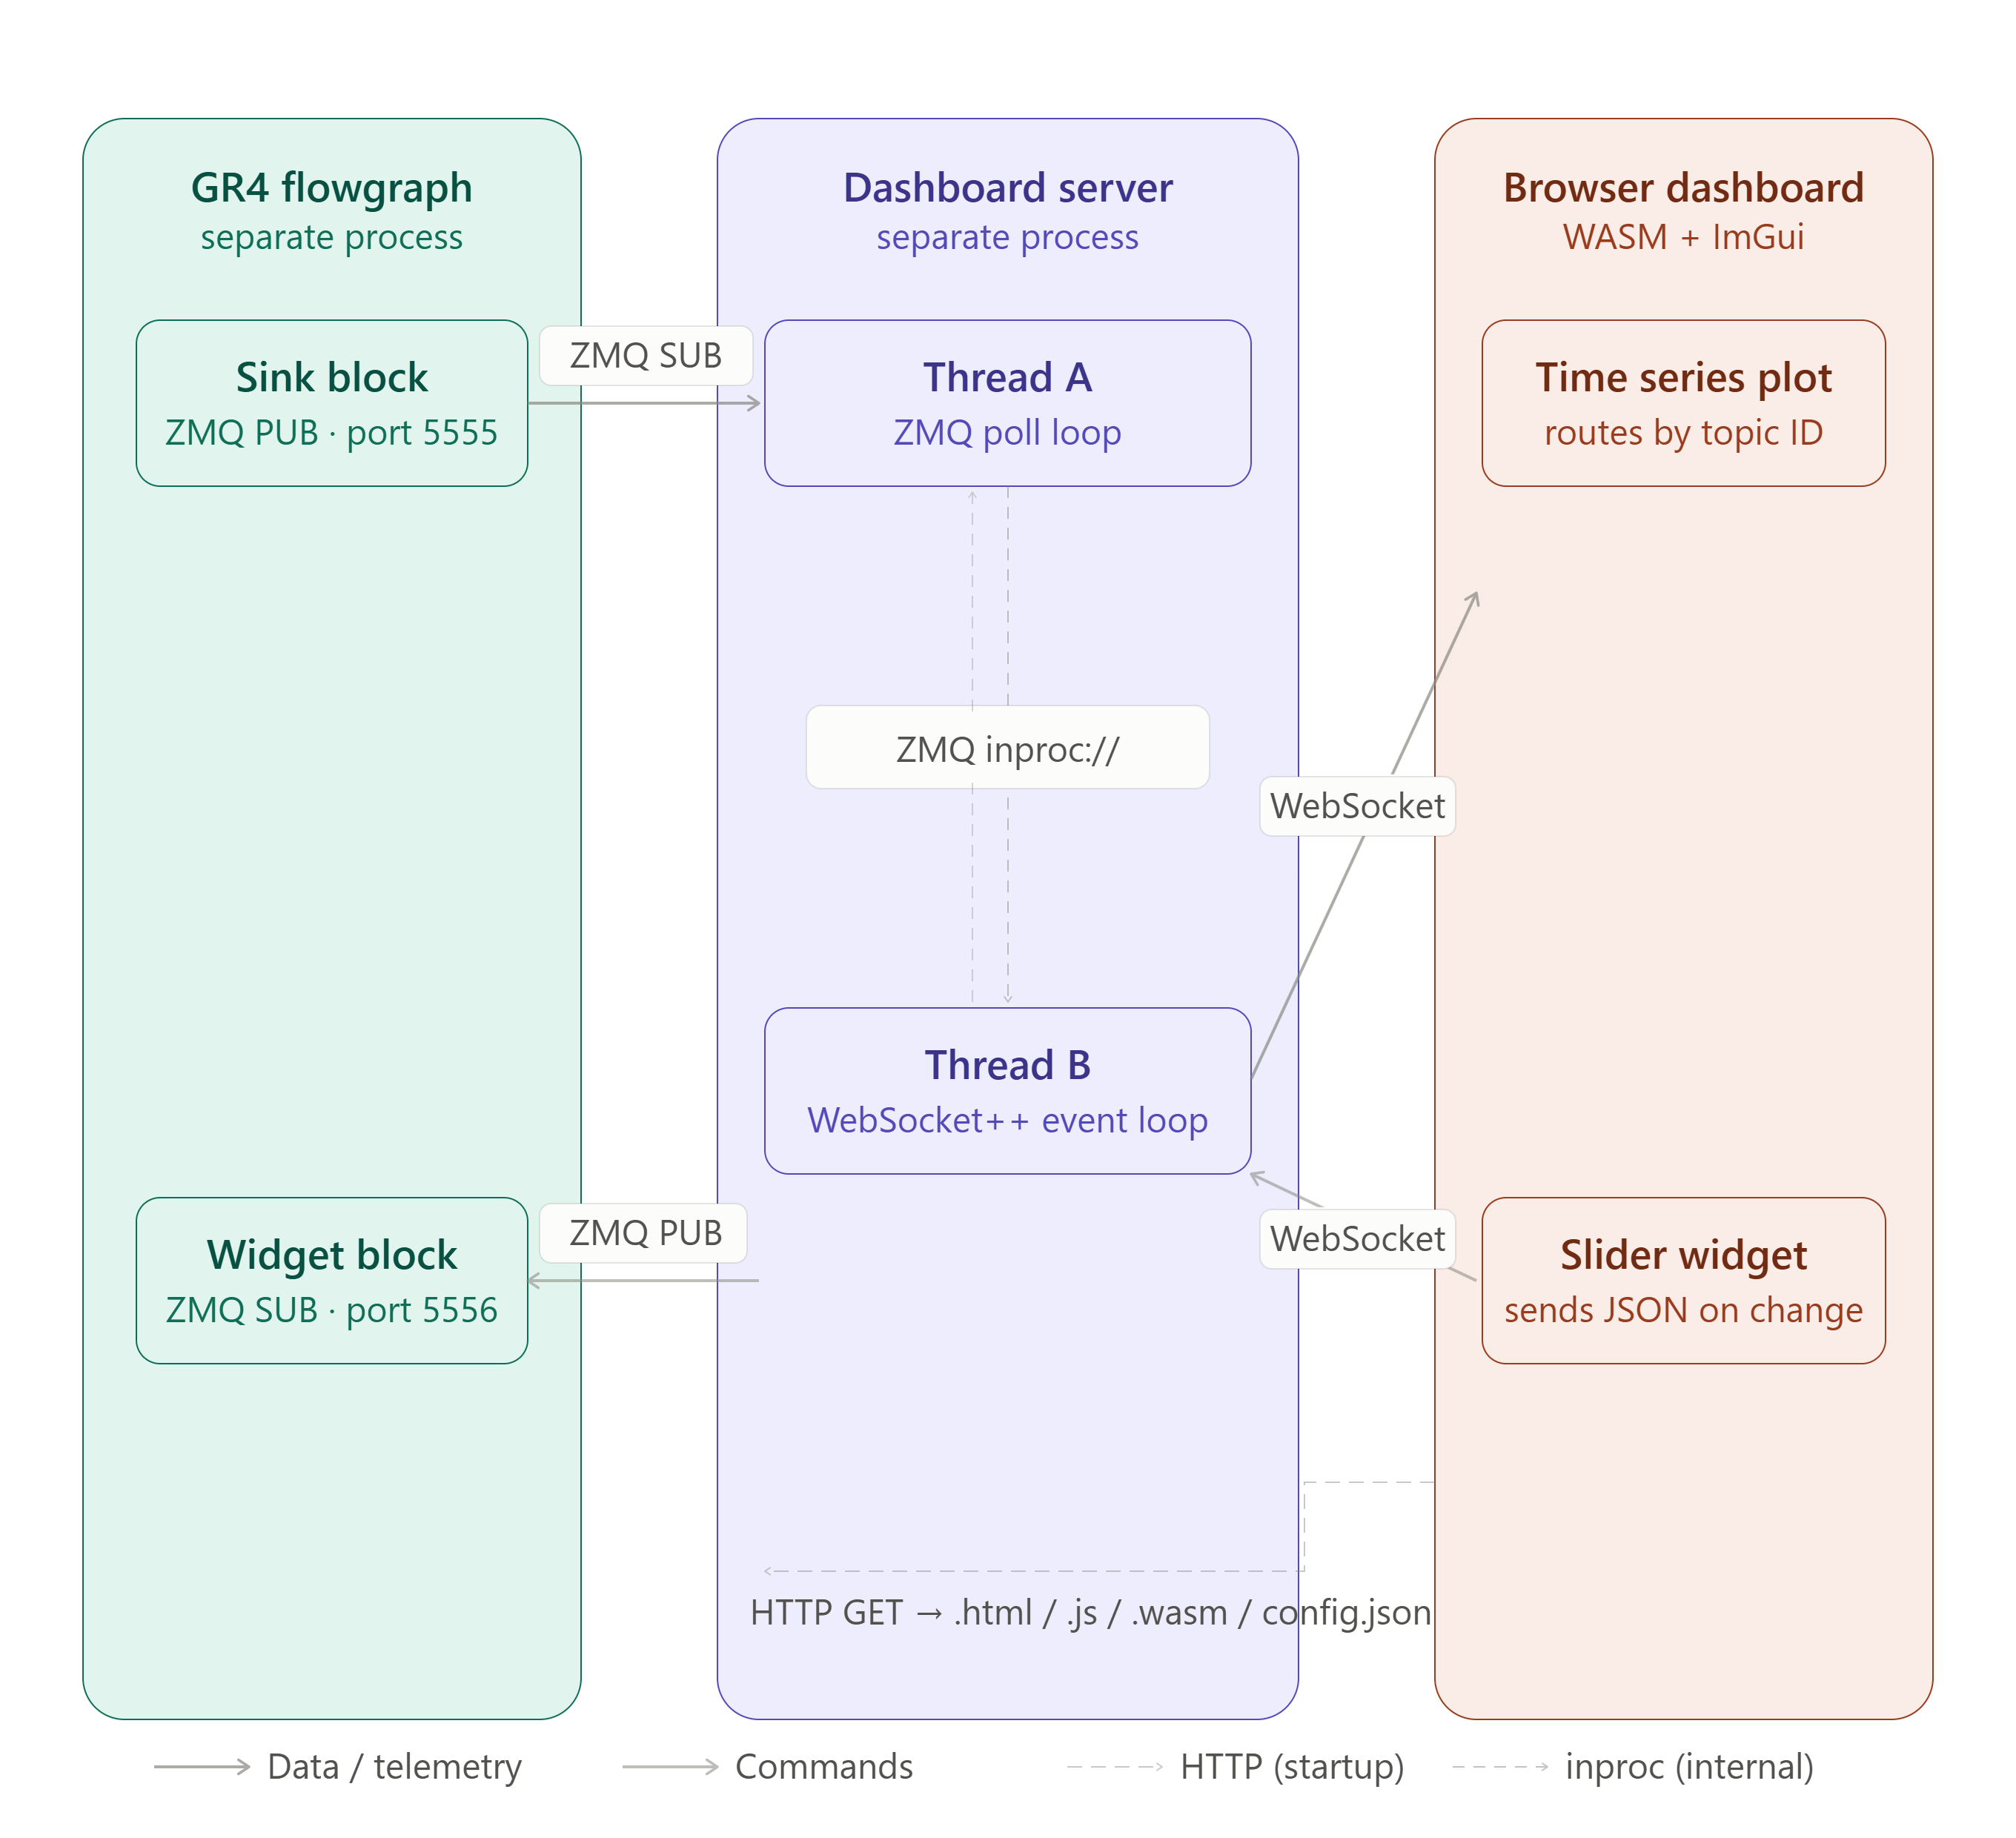
Based on the experiences gained while making the POC and what was layed out in the original proposal, i decided to use an approach which seperated the networking completely from the flowgraph. This was achieved via having the networking be handled by a seperate process.
I call the program running in this seperate process the dashboard server which i created using websocket++ networking library, with the IPC between the flowgraph and the server dashboard being done through ZMQ.
The server dashboard itself is actually comprised of two threads, one for handling the ZMQ connections (Thread A) and one for handling the networking with the browser (Thread B), this was necessary as the blocking nature of the server clashed with the rest of the processes functions.
Details of the Core Architecture
Lets discuss what happens on startup and then i think it would be best to describe the core architecture via the points of communication between the flowgraph, dashboard server, and the dashboard in the browser.
What happens on startup of flowgraph ?
-
GR4 flowgraph process starts up dashboard server process (note: this is not yet implemented, currently both processes are started manually)
-
GR4 flowgraph generates config file which states what sinks & widgets are in the flowgraph (note: also not yet implemented, config file is currently written by hand)
Sending dashboard to browser on startup
-
You write in the IP address of the device running the flowgraph in your browser. This sends a http get request to the dashboard server.
-
The dashboard server on recieving this get request rapidly pushes the configurable dashboard files (
.wasm,.js,.html) along side the config file. (The config file specifices to the dashboard what sinks & widgets are present and their IDs so it can distinguish what data is meant for which plot aswell as what header it needs to attach in order to send updates to the widgets)
Once these two steps are done data for the plotting can be sent to the dashboard and updates from widgets can be sent to the flowgraph.
From the flowgraph to the dashboard
1) Each sink has a publisher ZMQ socket which on each work tick appends a unique ID to the data to be plotted and pushes it to a subscriber ZMQ socket in thread A of the dashboard server. (The ID is important for the dashboard in the browser)
2) A thread safe handoff is achieved to thread B of the data via WebSocket++ thread safe send() function
3) Thread B contains a asynchronous event loop which now wakes up formats the data to websocket frames and pushes the data to the dashboard
4) The data reaches the dashboard in the browser and using the unique ID the dashboard plots the data on the correct plot
From dashboard to the flowgraph
1) On some kind of change occuring to a widget in the dashboard a .json packet is prepared with the unique identifier of that widget and the new value of the widget, transmitted to the dashboard server via a websocket
2) The dashboard server’s websocket catches the packet and the data is then pushed to thread A via ZMQ inproc:// socket (This is a thread safe non-locking memory queue)
3) Once thread A recieves the the packet it pushes it out via a ZMQ publisher socket to all widgets in the flowgraph.
4) The ZMQ subcriber sockets filter out any packets meant for other widgets via using the unique ID of the widget
Note that thread A wakes up only on packets being sent to it as ZMQ_POLL is used which sleeps the thread until a packet is recieved (Yes the naming convention of ZMQ_POLL is odd as its interrupt based not polling based)
Why this approach
The main benefit of this approach is that it seperates the networking completely from the flowgraph process, if some kind of exception or fault is thrown by the networking side of things the flowgraph keeps running no problem, this fault isolation is very good for a module thats about remotley monitoring a flowgraph in some kind of headless device. You wouldnt want the use of the module to be a liability to the flowgraph running on this headless device.
The added latency due to the IPC can be considered negligable, the main bottleneck will always be the network latency itself which we cant really tackle using this module.
What needs to be done next
There are 3 main things which need to be finished to consider the core architecture completely done.
1) Figure out how to get the flowgraph to start the dashboard server process — currently both the flowgraph and the dashboard server are launched manually as separate processes. Ideally the flowgraph should handle spawning the dashboard server on its own.
2) Figure out how to make the dashboard generate the config file — currently the config file is written by hand, It needs to be automatically generated by the flowgraph. this should be doable as reflection exists in GR4, meaning the flowgraph should be able to inspect its own blocks and automatically generate the config describing what sinks and widgets are present.
3) Send updates of the widget values alongside the sink data — an oversight from when the code was written. Currently when a sink pushes data to the dashboard, only the raw DSP data is sent. The current state of widget values should be sent aswell so the dashboard always has an up to date picture of the flowgraph state.
Once these three things are done the main core of the module should be good to go.
Thanks for reading, if you have any, please do send feedback to me via email or on the GNU Radio matrix, see you next week !
The code for this can be found on the V1_Dev branch of the the repo
tags: